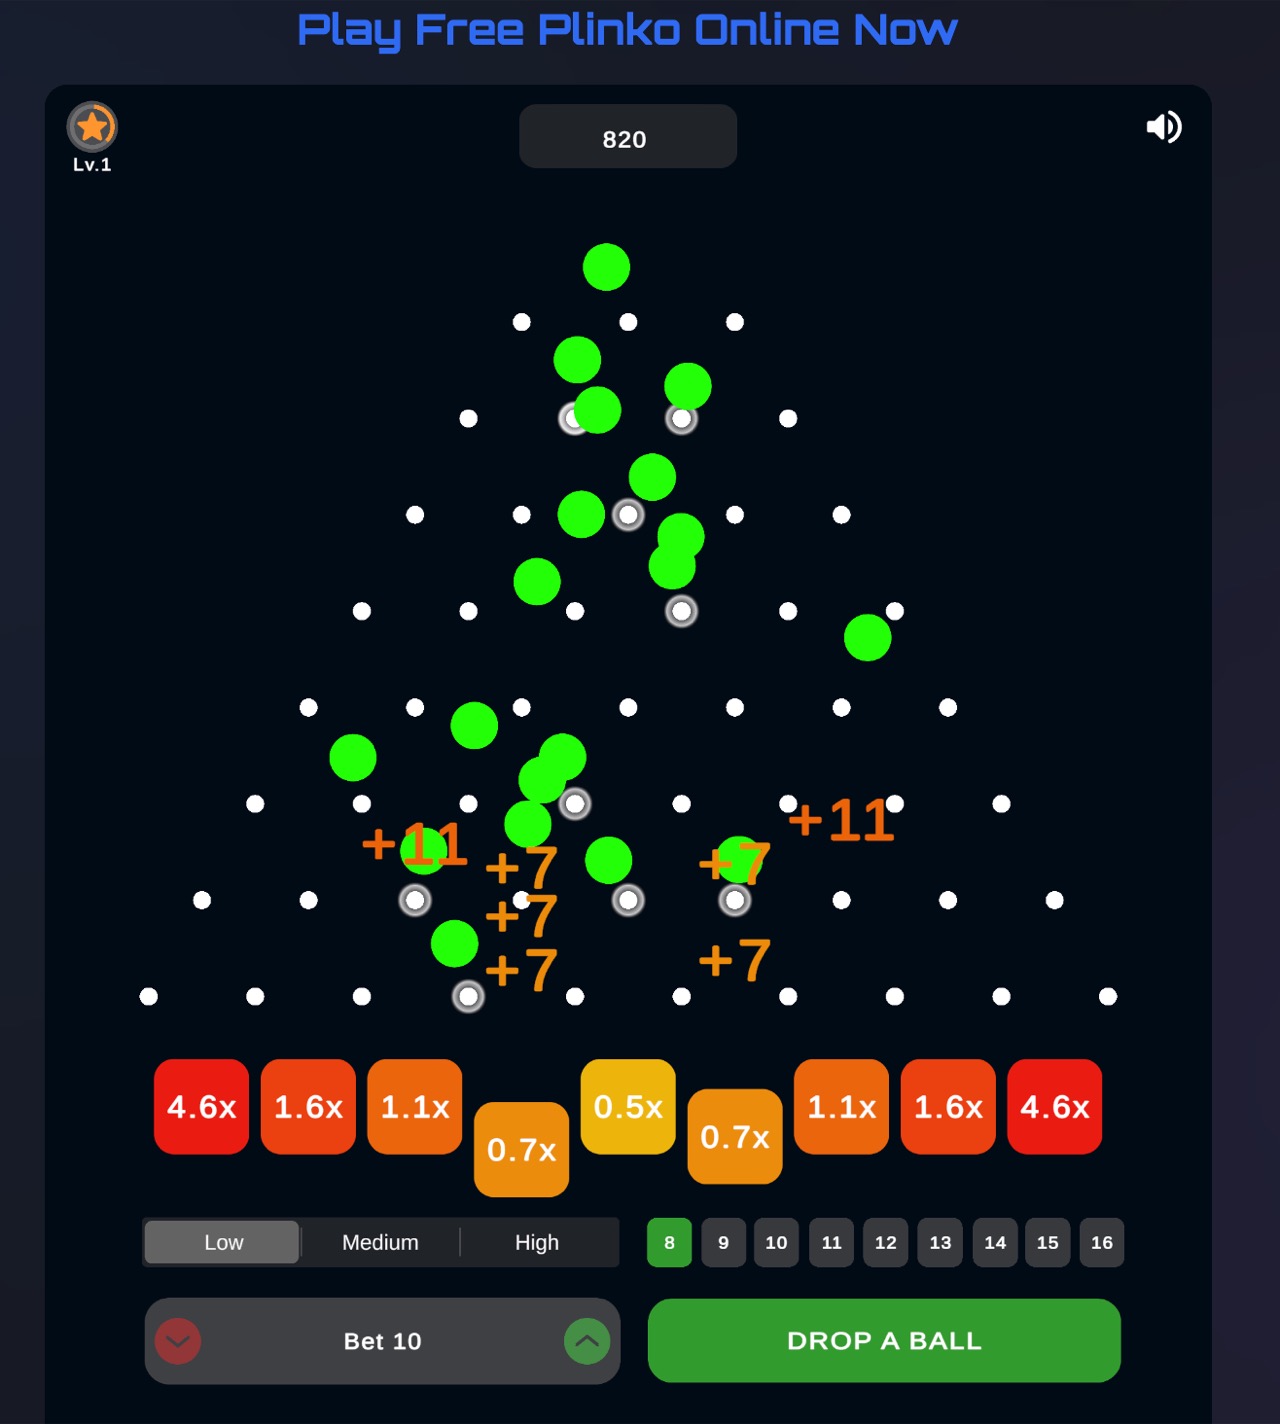
What Is a Plinko Simulator?
A Plinko simulator is a digital recreation of the Galton board, a device invented by Sir Francis Galton in 1876 to demonstrate how random binary events produce a normal distribution. The concept is simple: a ball drops from the top of a triangular grid of pegs. At each peg, the ball deflects either left or right. After passing through every row, it lands in one of the slots at the bottom.
What makes this interesting — and the reason statisticians have studied it for over a century — is that the final landing position is not equally random across all slots. The center slots receive far more balls than the edges. Drop enough balls through the simulator and a bell-shaped pattern emerges, every single time. That pattern is the normal distribution, and the Plinko board is one of the most intuitive ways to see it happen.
Unlike a simple random number generator that picks a slot at random, a proper Plinko simulator models each peg collision individually. The ball's final position is the cumulative result of many independent left-or-right decisions — one at each row. That is what makes it a simulation rather than just a randomizer. Every bounce matters, and the overall pattern only becomes visible after many drops.
Plinko Simulator — Quick Facts
- Based on: Galton board (1876) — binomial distribution model
- How it works: Ball makes one left/right decision per peg row
- Result: Landing positions form a bell curve over many drops
- Adjustable: Row count (8, 10, 12, 14, 16) and risk level
- Cost: Completely free — virtual credits only
- Devices: Any browser — mobile, tablet, desktop
How Probability Shapes Every Drop
Every time a ball hits a peg in the Plinko simulator, it has roughly a 50/50 chance of going left or right. That single decision seems meaningless on its own. But string together 12 of those decisions (one per row in a 12-row board), and the math starts to show itself.
Think of it this way. To land in the far-left slot on a 12-row board, the ball needs to bounce left at every single peg — all 12 times. The probability of that happening is 0.5 raised to the 12th power, which works out to about 1 in 4,096 drops. Landing in the far-right slot requires the same thing but in the opposite direction. Same odds: roughly 1 in 4,096.
Now compare that to the center slot. To land in the middle, the ball needs approximately 6 left bounces and 6 right bounces — in any order. There are 924 different peg-path combinations that produce that result. So the center slot is roughly 924 times more likely than either extreme edge. That is why the middle fills up so quickly in the simulator.
This distribution follows the binomial probability formula. For a board with n rows, the probability of landing in slot k (counting from the left, starting at zero) is:
The Math Behind the Bounces
P(k) = C(n, k) × 0.5^n
Where C(n, k) is the number of ways to choose k left-bounces out of n total bounces. This is the binomial coefficient — the same formula that appears in Pascal's triangle, coin-flip problems, and population genetics. Plinko is just the most visual way to watch it work.
You do not need to memorize the formula to appreciate the result. Just drop 200 balls in the simulator and look at the landing pattern. The center will be stacked high, the edges will be nearly empty, and the shape will look unmistakably like a bell. That is the central limit theorem playing out right in front of you.
Simulator Settings: Rows, Risk, and Distribution
One of the most useful features of a Plinko probability simulator is the ability to change the board configuration and immediately see how it affects the distribution. The two primary settings are row count and risk level. Each one changes the shape of the bell curve in a different way.
How Row Count Affects the Curve
More rows mean more peg decisions per drop. This stretches out the distribution and makes the bell curve smoother. Fewer rows create a choppier, more concentrated pattern. Here is how the most common row counts compare:
| Rows | Possible Slots | Edge Probability | Center Probability | Variance |
|---|---|---|---|---|
| 8 | 9 | ~1 in 256 | ~27.3% | Low |
| 10 | 11 | ~1 in 1,024 | ~24.6% | Low-Med |
| 12 | 13 | ~1 in 4,096 | ~22.6% | Medium |
| 14 | 15 | ~1 in 16,384 | ~20.9% | Med-High |
| 16 | 17 | ~1 in 65,536 | ~19.6% | High |
Notice the pattern: as row count increases, the probability of hitting an edge slot drops dramatically, while the center probability decreases only slightly. With 16 rows, the ball has to make 16 consecutive same-direction bounces to reach an edge — an event you would expect to see roughly once every 65,536 drops. In the simulator, you can run thousands of drops in minutes and confirm this for yourself.
How Risk Level Reshapes the Payouts
Risk level does not change the physics of the simulation. The ball still bounces left or right with the same probability at each peg. What risk level changes is the multiplier values assigned to each landing slot. On low risk, the multipliers are compressed — the center pays close to 1x and the edges pay moderately more. On high risk, the center slots pay far below 1x while the edge slots carry extreme multipliers like 100x or even 1000x.
- Low risk: Tight multiplier range. Most drops return close to your bet. The bell curve works in your favor because the highest-probability center slots have decent payouts. Good for observing consistent, predictable outcomes.
- Medium risk: Wider spread. Center slots pay less than 1x, but the mid-range slots offer 2x to 5x returns. The distribution becomes more interesting to watch because occasionally a ball drifts far enough from center to hit a meaningful multiplier.
- High risk: Extreme spread. The center — where most balls land — pays 0.2x to 0.5x. But the edges carry 100x, 500x, or even 1000x multipliers. This is where the Plinko simulator gets exciting for probability testing, because you are betting against the bell curve itself. Most drops lose value, but the rare edge hit is enormous.
In the simulator, switching between risk levels on the same row count is the fastest way to understand how payout structure interacts with probability distribution. The physics stay the same. Only the reward mapping changes.
Visualizing the Bell Curve in Real Time
The most powerful feature of a Plinko simulator is something you cannot get from a textbook: watching the bell curve assemble itself, one ball at a time. After your first drop, the landing pattern is meaningless — a single data point could be anywhere. After 10 drops, you might see a rough cluster near the center. After 50 drops, the shape starts to emerge. By 100 drops, the bell curve is unmistakable.
This is genuinely useful if you have ever struggled to understand why normal distributions show up everywhere in the real world — test scores, heights in a population, measurement errors in a laboratory. The Plinko board makes the underlying mechanism visible. Each ball is an independent trial. Each peg is a binary random event. And the accumulation of hundreds of those tiny random events always converges on the same bell shape.
What to Watch For
- Early drops (1-20): The pattern looks random and scattered. Individual results dominate. You might see a ball hit an edge slot and think the distribution is flat. It is not — you just do not have enough data yet.
- Mid-range (50-100 drops): The center starts stacking up noticeably higher than the sides. The rough outline of a bell shape appears, but it is still jagged and uneven. This is the phase where statistical concepts like "sample size" start making intuitive sense.
- Large sample (200+ drops): The bell curve is smooth and clear. The center towers over the edges. The pattern closely matches the theoretical binomial distribution. At this point you are seeing the law of large numbers in action — individual randomness has been absorbed into the aggregate pattern.
- Extreme sample (1000+ drops): The distribution becomes nearly perfect. Every slot's fill height matches its theoretical probability to within a few percent. This is what statisticians mean when they talk about convergence.
Try running the simulator on 8 rows first, then switching to 16 rows and repeating the same number of drops. You will see the bell curve get narrower and taller relative to the board width on 8 rows, and wider and flatter on 16. That is variance in action — and it is far easier to grasp when you can watch it happen than when you read about it in a formula.
Plinko Simulator vs Random Number Generator
Not every Plinko game is actually a simulation. Some platforms skip the physics entirely and just use a random number generator (RNG) to pick a landing slot, then play an animation of a ball bouncing down to match. From the outside, these look the same. But there is a meaningful difference, and it matters if you care about the math.
How a True Simulator Works
A real Plinko simulator computes each peg collision independently. The ball hits Row 1 and goes left or right. Then it hits Row 2 and goes left or right again. This continues for every row on the board. The final position is the sum of all those individual decisions. The animation you see on screen reflects the actual computed path — what you watch is what happened in the simulation.
This approach naturally produces the binomial distribution. You do not have to program the bell curve in — it emerges from the physics. That is what makes it a simulator rather than a random picker.
How an RNG-Based Game Works
An RNG approach picks the final slot first, using weighted probabilities that match the theoretical distribution. Then it generates an animation that sends the ball to that predetermined destination. The path the ball takes through the pegs is cosmetic — it does not determine the outcome.
Both methods produce the same statistical results over many drops. The landing distribution is identical. But there is an important philosophical difference: in the simulator, each peg bounce is genuinely random and the outcome emerges from the process. In the RNG version, the outcome is decided before the ball even starts falling.
| Feature | Physics Simulator | RNG-Based |
|---|---|---|
| Outcome determined by | Individual peg collisions | Pre-selected weighted random slot |
| Ball path | Reflects actual computed bounces | Cosmetic animation to match result |
| Distribution | Emerges naturally from physics | Programmed to match theoretical odds |
| Educational value | High — shows how distribution forms | Low — just a visual wrapper on RNG |
| Statistical result | Same bell curve | Same bell curve |
| Verification | Path can be traced peg-by-peg | Path is decorative only |
For probability testing and learning, a physics-based Plinko simulator is the better tool. You can trace exactly why a ball ended up where it did — it went left at Row 3, right at Row 4, left at Rows 5 through 7, and so on. That traceability is what turns the game from entertainment into a genuine simulation tool. Our Plinko simulator at Crash or Cash uses the physics-based approach, computing each bounce independently.
Using the Simulator to Test Strategies
One of the most practical things you can do with a free Plinko simulator is test different configurations before committing to them. Since the simulator uses virtual credits, there is zero cost to running hundreds or thousands of drops under different settings. Here are some experiments worth trying.
Experiment 1: Row Count Comparison
Set the risk level to medium and run 500 drops on 8 rows. Note how many times you hit the center versus the edges. Then reset and run 500 drops on 16 rows with the same risk level. You will see that the 16-row board produces a wider spread of outcomes. Edge hits are rarer but still possible, and the overall variance is higher. This tells you that more rows mean more unpredictability in individual drops — even though the average outcome stays similar.
Experiment 2: Risk Level Sweep
Pick a single row count — 12 is a good middle ground — and run 200 drops on low risk. Track your virtual balance. Then run 200 drops on medium, and 200 on high. On low risk, your balance will fluctuate gently and stay close to where it started. On medium, the swings get bigger. On high risk, you will likely see your balance drop steadily with occasional sharp spikes when a ball reaches the outer slots. This experiment makes it clear that risk level is really about volatility, not about expected return.
Experiment 3: The Streak Test
Set the simulator to high risk and 16 rows, then watch for how long you go between edge hits. You might drop 500 balls before one reaches an edge multiplier. This exercise is useful because it builds realistic expectations. If you see the bell curve data showing that edge hits happen roughly once in 65,000 drops on a 16-row board, and then you actually experience a drought of hundreds of drops with no edge hit, the math stops being abstract and becomes something you have felt firsthand.
Experiment 4: Sample Size and Convergence
Run 10 drops and record the distribution. Run 100 more and record it again. Then 1000 more. Watch how the jagged early pattern smooths into a clean bell curve. This is the law of large numbers in action, and the Plinko simulator is one of the best tools for developing an intuitive sense of how much data you actually need before a pattern becomes reliable.
Strategy Testing Tips
- Always test with large samples. 50 drops is not enough to draw conclusions. Aim for at least 200, ideally 500+.
- Change one variable at a time. If you adjust both row count and risk level simultaneously, you will not know which change caused the difference in results.
- Track your balance over time. The simulator's virtual credits let you see how different settings affect long-run outcomes without any financial risk.
- Compare your results to theory. After running 500 drops on 12 rows, check whether the center slot received roughly 22-23% of all balls. If it did, the simulator is performing as expected.
Ready to see the bell curve for yourself? Open the Plinko simulator, drop a few hundred balls, and watch probability come to life — completely free.
Open Plinko SimulatorFrequently Asked Questions
Is the Plinko simulator fair?
Yes. The simulator computes each peg collision independently with an approximately 50/50 left-right split. There is no hidden weighting or predetermined outcome. You can verify this yourself by running a large number of drops and checking whether the landing distribution matches the expected binomial curve. Over 500+ drops, it will.
Can I test the bell curve with the simulator?
Absolutely — that is one of its primary uses. Drop 100 or more balls and watch the landing pattern. The center slots will accumulate significantly more balls than the edges, forming the characteristic bell shape. The more drops you run, the smoother and more clearly defined the curve becomes. It is one of the most intuitive ways to see the central limit theorem in action.
How many drops do I need to see a clear bell curve?
The bell shape typically becomes recognizable after about 50 to 100 drops. By 200 drops, the pattern is fairly smooth. At 500 or more drops, the distribution closely matches the theoretical binomial probabilities. The fewer rows you use, the faster the pattern emerges — an 8-row board shows the bell shape more quickly than a 16-row board because there are fewer possible landing positions.
Does row count change the probability?
Row count changes the granularity of the distribution, not the fundamental shape. More rows mean more possible landing slots and a wider spread, which makes each individual slot less likely. But the overall shape remains a bell curve regardless of row count. The key difference is variance — 16-row boards have far more extreme edge odds than 8-row boards. On 8 rows, an edge hit occurs roughly once per 256 drops. On 16 rows, it is closer to once per 65,536.
What is the difference between a Plinko simulator and a random number generator?
A true Plinko simulator computes each peg bounce individually — the ball hits Row 1, goes left or right, hits Row 2, goes left or right, and so on. The final position is the sum of all those independent collisions. An RNG-based system picks the final slot first using weighted probabilities, then plays an animation to match. Both produce the same statistical distribution, but the simulator is more transparent and educationally valuable because each step of the process is genuine.
Can I use the simulator to predict outcomes?
You cannot predict individual outcomes — each drop is independent and random. What you can predict is the aggregate pattern over many drops. The simulator lets you confirm those aggregate predictions experimentally. After enough drops, you will see that roughly 22-23% of balls land in the center slot on a 12-row board, matching the binomial probability exactly. Individual drops remain unpredictable by design.
Is the Plinko simulator free to use?
Yes, completely free. The simulator runs on virtual credits with no real money involved. There is no signup, no download, and no account required. You can run as many drops as you want, test any configuration, and reset your balance at any time. It works in any modern browser on phones, tablets, and desktop computers.